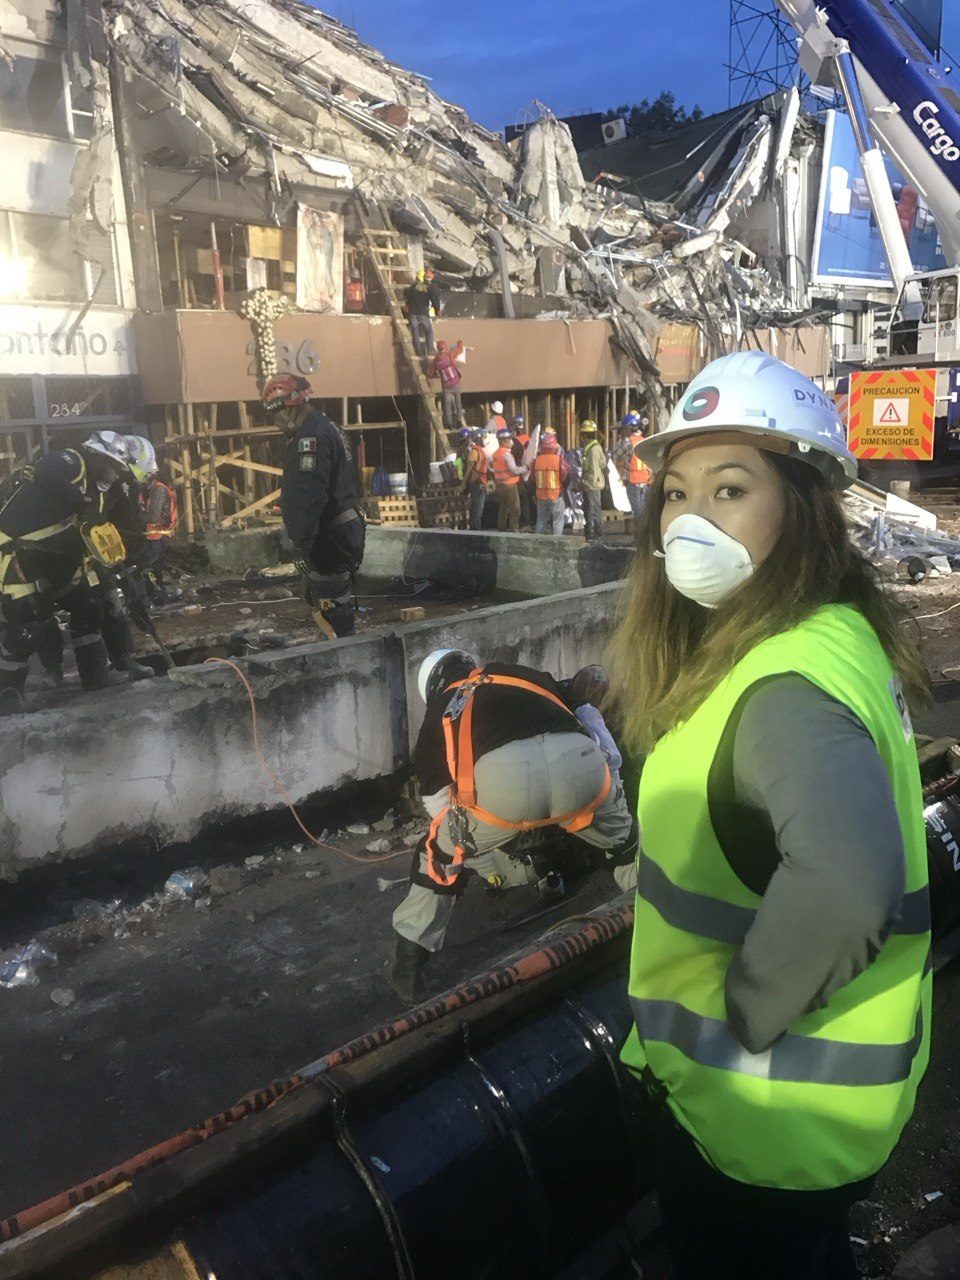
At 13:14 on 19 September 2017 — thirty-two years to the day after the 1985 disaster — an M7.1 struck beneath Puebla and shook Mexico City hard. By the time the dust settled, dozens of buildings had collapsed and hundreds more were unsafe. We packed our gear and went. You learn more about how structures really behave in a week on the ground than in a year of models.
Why we go
A risk model is only as honest as the reality it is checked against. After a major earthquake, the city becomes a full-scale laboratory: every standing and fallen building is a data point on how real structures respond to real shaking. We went to record those data points — the collapse modes, the soil conditions, the patterns — while they were still there to read.
What we found
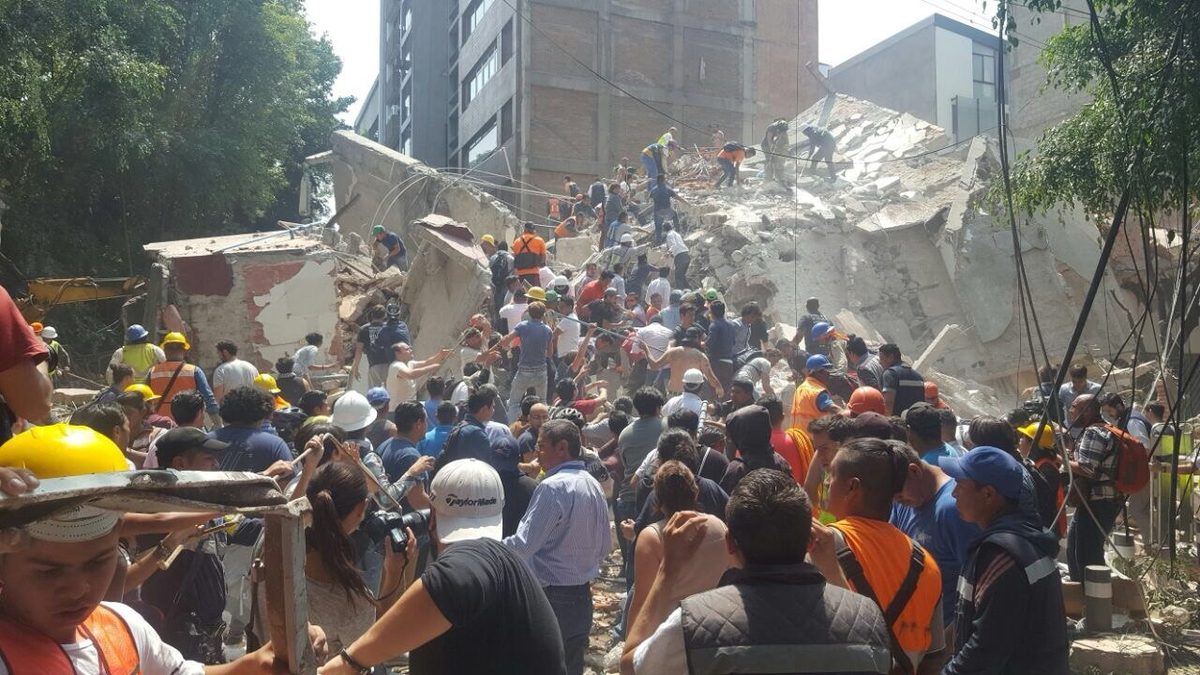
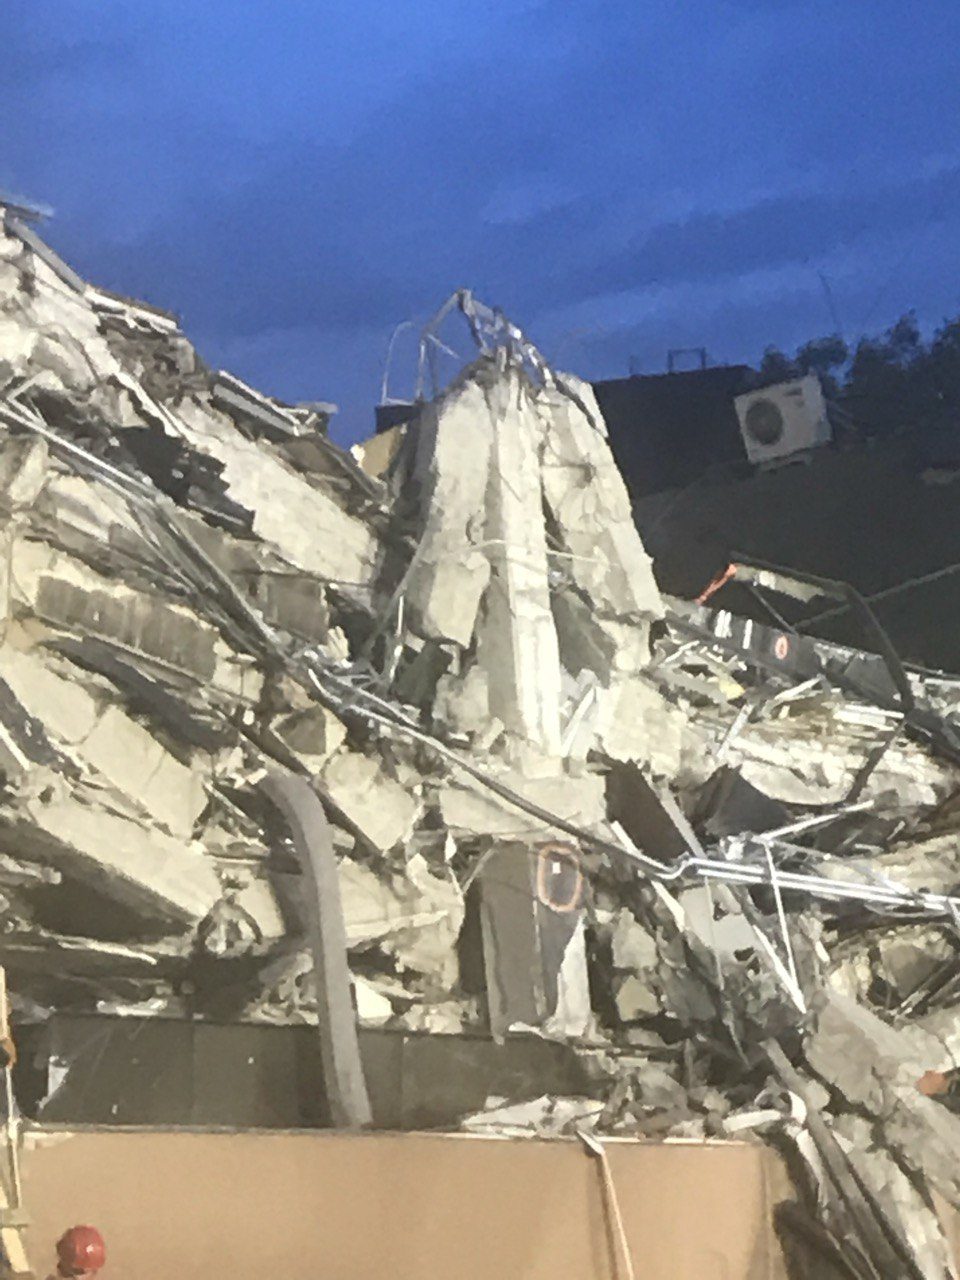
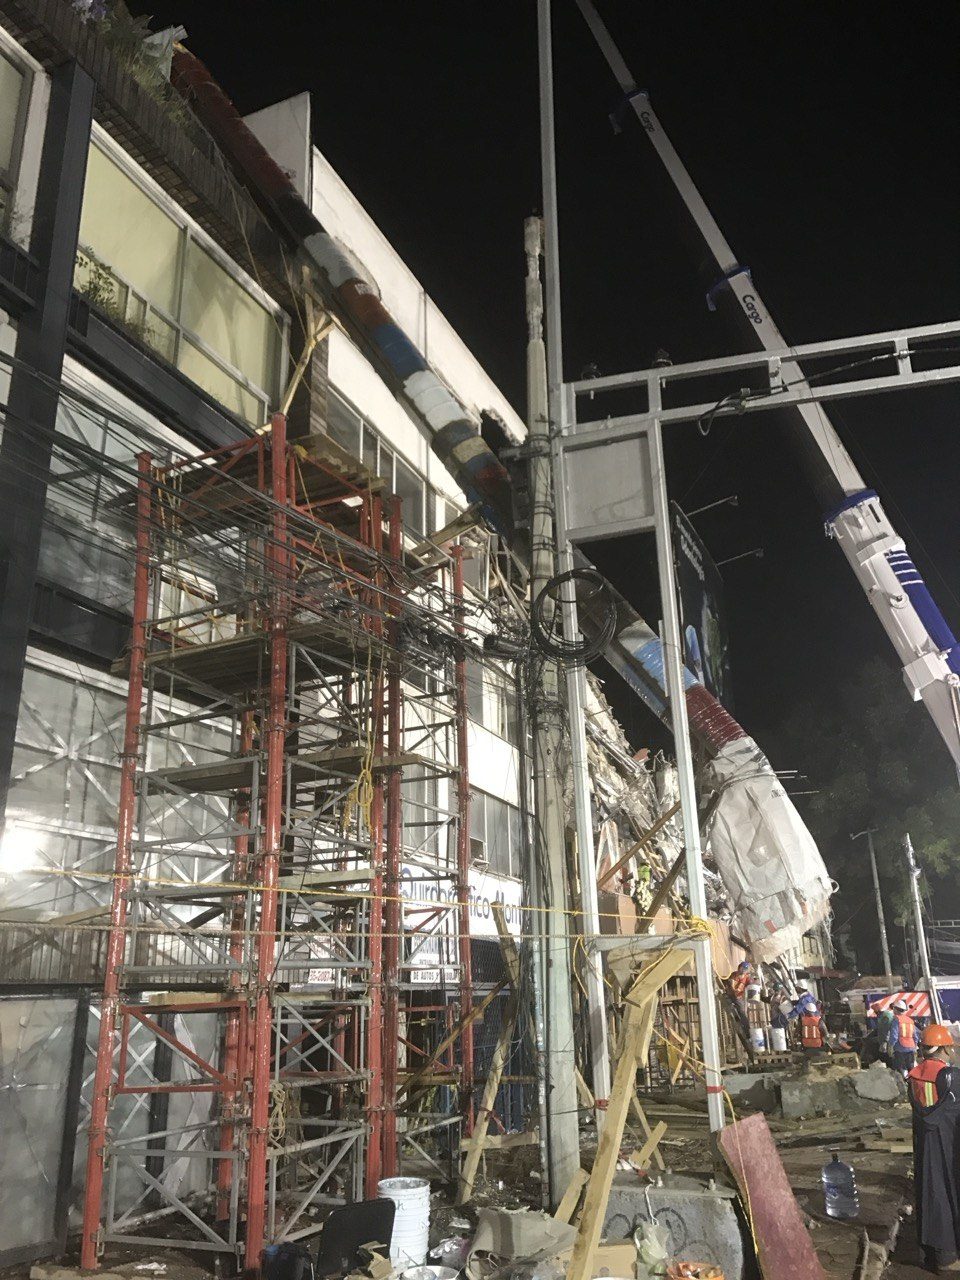
The damage was not random. Mexico City sits on the soft sediments of a drained lake, and those soils amplified and stretched the shaking — punishing buildings of a particular height far more than their neighbours. Where the ground's rhythm matched the building's, the result was often catastrophic: pancake collapses, floor stacked flat on floor, the failure mode that cost the most lives.
Up close, the story repeated: slabs pancaked onto columns that could not hold the drift, reinforcement torn where detailing fell short of the demand. Every façade was a lesson in what separates a structure that deforms and survives from one that does not.
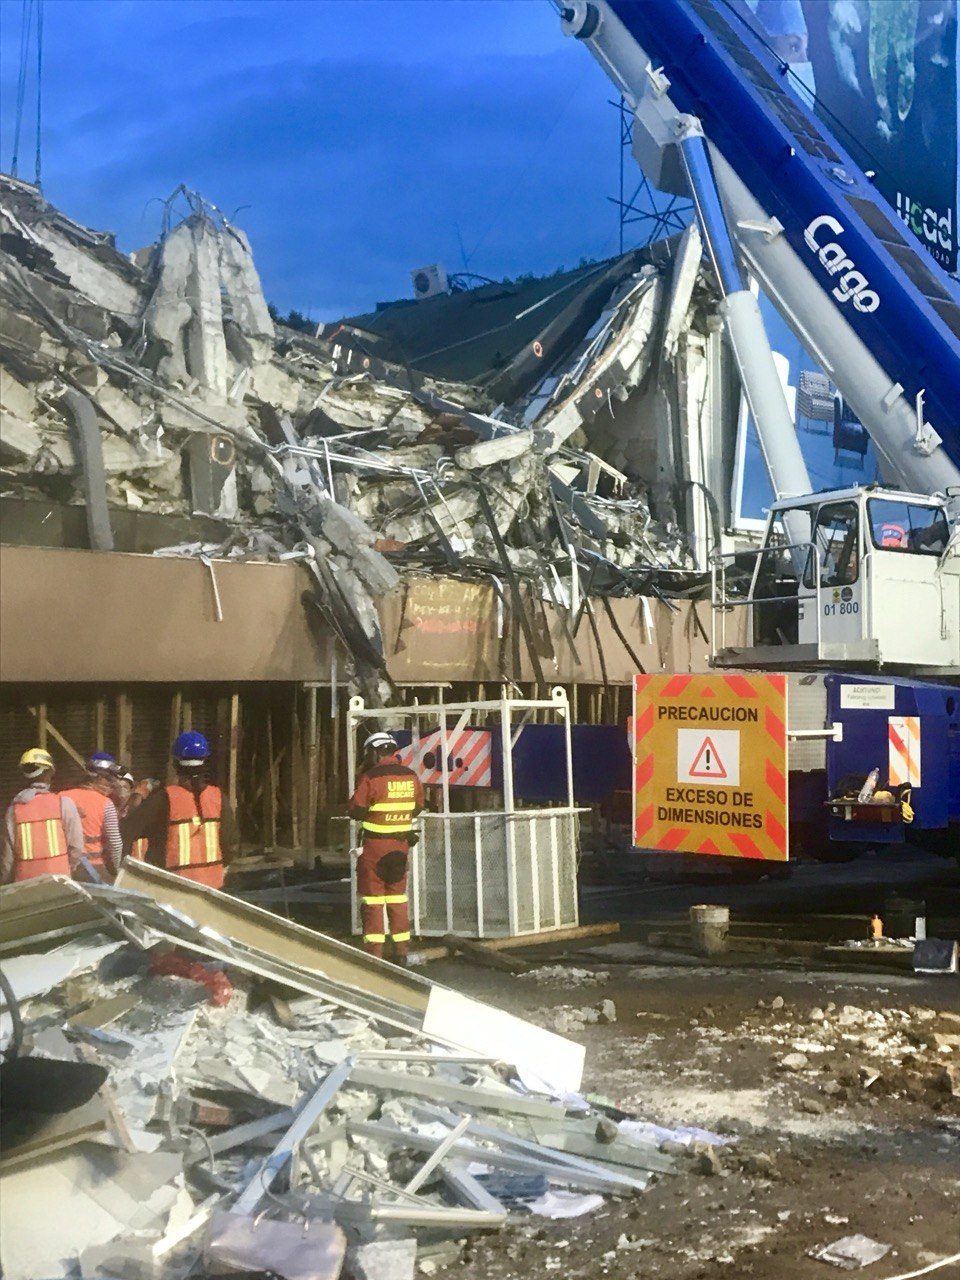
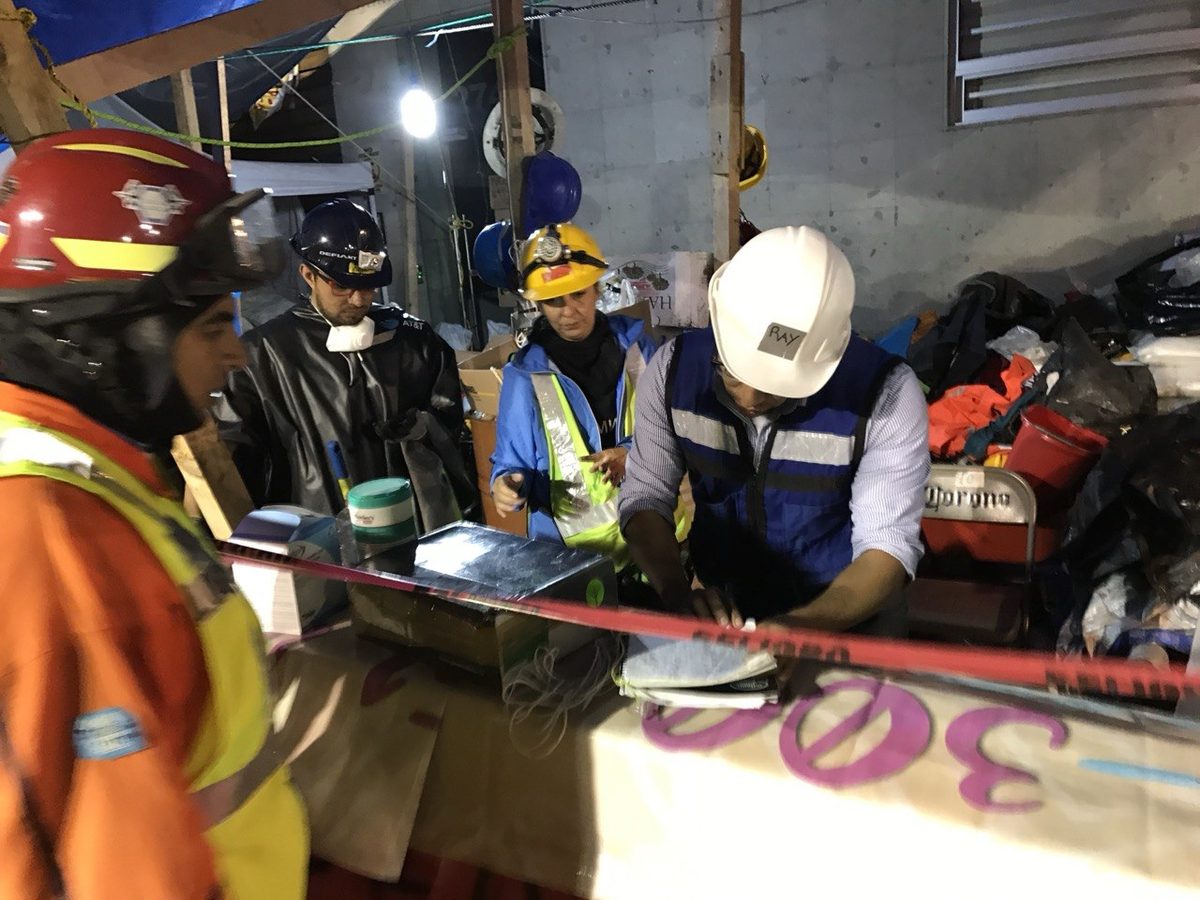
Through it all, the response never stopped — emergency shoring going up by night to hold damaged buildings, command posts improvised on folding tables, plans read under work lights.
Why it mattered for risk
For a risk or cat-modelling team, three lessons travel beyond Mexico City:
- Site conditions can dominate loss. The same earthquake produced very different outcomes block by block because of the soils underneath — an effect a city-average model smooths away and a portfolio pays for.
- Collapse is selective, not uniform. Which building falls depends on how its structure answers the amplified motion. Capturing that needs engineering-grade vulnerability, not an off-the-shelf curve.
- Real performance is the only honest calibration. The buildings that fell — and the many that did not — are the evidence that turns a generic loss assumption into one a CRO can defend.
From the field to the engine
"Fragility curves today are built on simplified assumptions. Ours are built on 15 years of designing structures that cannot fail. By embedding performance-based seismic design into AI-driven models, we transform fragility from generic to engineering-grade. This is not an incremental improvement — it's a structural shift in how seismic risk is quantified."
— Carlos Caramés Molero, Founder & Partner, DynamisMexico City 2017 is exactly the kind of ground truth behind that claim. Knowing which structures fail, and why, under amplified motion is what makes a fragility curve engineering-grade — and it is woven into the way Xpectral quantifies loss for portfolios on soft soils anywhere.
Key questions
Why did some buildings collapse while neighbours stood?
Mexico City sits on an old lakebed. Those soft soils amplified and lengthened the shaking, hitting mid-rise buildings of a particular height hardest. Collapse concentrated in structures whose response matched that amplified motion — a site-and-structure interaction a generic model averages away.
What does post-earthquake reconnaissance add to a risk model?
Seeing which buildings fail, and how, calibrates vulnerability against reality instead of assumption. That real performance is what turns a generic fragility assumption into an engineering-grade one — and it sharpens the PML and accumulation view for a portfolio in the same soil conditions.
Is the 2017 lesson specific to Mexico City?
No. Any portfolio over soft basin or lakebed soils — and there are many major cities on them — carries the same amplification risk. Site conditions can dominate loss, and must be modelled site-specifically rather than smoothed.